Statistics
By introducing children to games that incorporate statistics and probability, we can foster their critical thinking skills and equip them with valuable tools for future decision-making. These games encourage children to analyze data, recognize patterns, and make informed judgments. Such skills are indispensable in various fields, from science and engineering to business and finance. Moreover, understanding statistics and probability can help children develop a deeper appreciation for the world around them, empowering them to make sense of complex information and make rational choices.

![]() Activity! Means (Average)
Activity! Means (Average)
One die, blocks
Roll the die, take that many blocks. Arrange blocks in a row. Each roll gets its own row. After each player has five rows, arrange it so that each of the five rows has the same amount of blocks. If there are any left over, leave them on the side. This is the mean for the five roles.
Now have all players put together their blocks and make each row the same number (if there are three players, find the mean for 15 rows. If there are four players - 20) For older children, don't use blocks, just paper and pencil to keep track of roles.
Probability
![]() Activity! Cup Toss
Cup Toss Probability Game by Children's Museum Houston
Activity! Cup Toss
Cup Toss Probability Game by Children's Museum Houston
![]() Activity! Fair Spinner (Law of Large Numbers)
Activity! Fair Spinner (Law of Large Numbers)
Make the spinner. Spin it 36 times. Keep track of which color occurs in a graph.
In theory the probability of red is 1/2, blue 1/4 and yellow 1/4. At 36 roles you will not get the expected results - but the bigger the number of roles, the closer to the expected probability (try 72 roles). To make it more fun for younger children, keep tally of the three colors with candy.
![]() Activity! Travel Higher or Lower
Activity! Travel Higher or Lower
The objective of the game is to correctly guess whether the next card drawn will be higher or lower than the current card. Shuffle a deck of cards. One card is dealt -this is the starting card. Player guesses wether the next card drawn from the deck will be higher or lower than the current card. For example, if the first card is a 7 of hearts, they would guess if the next card will be higher (8, 9, 10, J, Q, K, A) or lower (2, 3, 4, 5, 6). Draw the next card - check the guess.
Discuss the composition of a standard 52-card deck (4 suits, 13 cards per suit, etc.)
- What's the probability of drawing a red card? (26/52 or 1/2)
- What's the probability of drawing an ace? (4/52 or 1/13)
- What's the probability of drawing a face card? (12/52 or 3/13)
Whomever can remember the probabilities is more likely to predict correctly. To check this hypothesis use this game to decide things. Who will go first? Who ever predicts the next card or is guesses closest gets to choose.
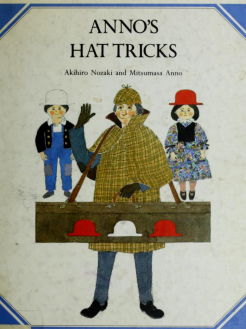
![]() Activity! Read Anno's Hat Trick
Activity! Read Anno's Hat Trick
Random
In statistics, a random sample is a subset of a population chosen in a way that ensures that every member of the population has an equal chance of being selected. This helps to prevent sampling bias, which occurs when a sample is not representative of the population. Randomness is also a factor in scientific experimentation. This is one reason we use a 'control' sample.
![]() Activity! Random Walk Spinner
Activity! Random Walk Spinner
Create one of the randomness card or spinner. Go out and take a 'random' adventure!
![]() Activity! Random Walk Dice
Spin the spinner and follow the directions.
Activity! Random Walk Dice
Spin the spinner and follow the directions.
Throw a die and go where the card says.
![]() Activity! Going for Broke
Activity! Going for Broke
In this game, the caregiver uses two dice, and each player (two or more) receives a piece of paper to track their scores. Draw five vertical lines on your paper, one for each round. The caregiver rolls the dice, and players add the numbers together after each roll. They then face a choice: they can either "go out" of the round and keep their current score or stay in the game to potentially increase their score with subsequent rolls.
However, there's a twist—if two ones are rolled, all students still in the game lose all their points for that round. The round concludes when all players have chosen to go out or when two ones are rolled. After each round, students tally their scores, and the game continues for a total of five rounds. The player with the highest cumulative score at the end of these rounds wins.
For older students, the game can be adapted to use multiplication instead of addition, providing a more challenging mathematical experience.
![]() Activity! Radiotherapy
Activity! Radiotherapy
(from the Royal Statistical Society) A simulation to explore radiotherapy in the setting of the right dosage. Tumor map/ Results table/ Damage to tumor cells
Population and Sample
![]() Activity! Candy Jar Estimation
Activity! Candy Jar Estimation
Fill a large jar with a known quantity of different colors of small candies or objects. Cover the jar with a cloth so that the size and shape of the jar is visible. One the table lay our a sample from the jar - large enough to show the proportions of different colors. Have students estimate not only the total number of items in the jar, but also guess the ration of colors based on the sample.
![]() Activity! Favorite Color (group activity)
Activity! Favorite Color (group activity)
Conduct a full group (ten or more people - extended family) census on a simple topic (e.g., favorite color). Then take a smaller sample (e.g., 5-10 people - child and child's immediate family) and compare the results to show how a sample can represent the larger population.
![]() Activity! M&M Color Distribution
Activity! M&M Color Distribution
Provide 5 small bags of M&Ms to child. Have them count colors in each of their "sample" and make a tally or graph for each bag its content's colors. Have child compare to the known color distribution for all M&Ms (the population). Discuss how sample size affects accuracy. *Note - color distribution varies from country to country.
![]() Activity! Square Area Nature Count
Activity! Square Area Nature Count
Define a section of the forest, tide pool or playground as the "population." Have child count all plants and insects in a smaller sample area (25 cm square) and use that to estimate the total for the whole area.
Graphs
![]() Activitiy! Quarter of a Mile
Activitiy! Quarter of a Mile
Have everyone willing to run a quarter of a mile (400 meters) for one week. Keep track of how long it takes everyone to run during the week.
![]() Activity! Walk
Activity! Walk
Find out how far each family member can walk in an hour.
![]() Activity! Create Your Own Survey (school activity)
Activity! Create Your Own Survey (school activity)
Write out 5 -10 questions about one topic that answers a question you have. For example: "Which ice cream flavors should we offer at the school cafeteria?" If there are only three flavors to be offered, and millions of flavors to choose from, you must gather data. Start by determining who will be surveyed - the entire school, specific grades, or just their class. Design a simple questionnaire asking respondents to rank their top 3 ice cream flavors from a list of options. Ask which flavors they do not want. Ask which flavors would they like to try in the future. If you can't survey every single person in your school, consider taking a sample (one random student from each class or grade). Distribute your survey, collect the data and tally the results.
Data
There are different types of data. For example - categorical. Categorical variables help us understand how people or things can be grouped together based on their characteristics. It helps us see patterns and make decisions. Quantitative variables are things we can measure with numbers, just like how we use a ruler to measure how tall something is or a scale to see how heavy it is.
![]() Activity! Categorical VS Quantitative
Activity! Categorical VS Quantitative
(From mathequalslove.net) ER Triage - Use the concept of triage to decide wether the information is categorical or quauntative.
Rossman & Chance Introduction to Statistics HW 4 problems
Budget
Purdue University Budget Game
in the bank or in the piggy bank Game (from Children's Museum Houston)
city budget game (from Children's Museum Houston)
![]() Money Activities
Money Activities
- 20% off a price
- Find out how much a product cost per ounce
- Sales tax
- Foreign money - relation of different types of money to each other
- Give child menu and ask them to pick what they want to each and calculate how much it will cost
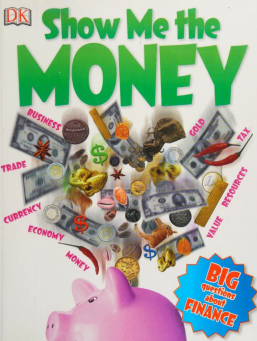
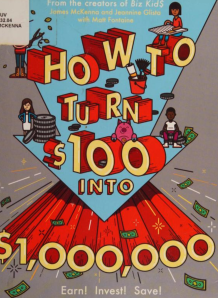
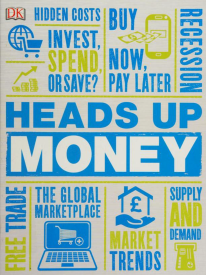
Kids Money Activities
Economics Crash Course
A common example is compound interest. If you invest $100 at a 5% interest rate compounded annually, the amount of money you have will grow exponentially over time. Each year, the interest is calculated based on the total amount you have, including the previous year's interest.
Physical Money
Making Change
Understanding how a Loan Works
Project: Ask your parents to loan you X amount of money for an agreed upon percentage of return - You don't want to the percent to be too high, then it will be hard to return the loan - but not too low either - so that there is an actual interest in making the loan
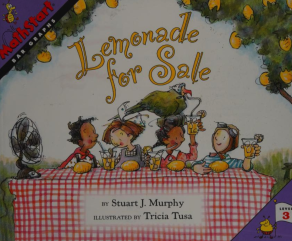
Use the money to start a business. It can be as small as a lemonade stand or as big as an online business.
Consider using the profit to bring economics to small communities in the world, through a microloan!
Money Learning Money Basics Middle to Teens
Concept - Stock Trading 16 years or younger with parents consent Students will be given access to 200 US dollars in a stock trading account set up for the purpose. Students will agree that after they double the profits, the original 200 will be returned for another student to use. After reaching 800 US dollar, another 200 will placed in a new student account for another student to use (so return of original sum plus creation of a second account). The account will then be released of its 'student account' status and the rest of the funds (400$) will be made available for student to withdraw, keep trading or turn over to the trading firm. Students who continue to grow their account will be asked to donate 1% of their profits for the first 5 years to Park Future Education to create more programs like this one. So if you make 1,000$ in profits from this account, you will be asked to donate 10 dollars - these profits will go to setting up more accounts for students like yourself and/or other programs that need funding. Remember, some accounts will fail and the money will be lost - that's the idea! Failure is an option. The role of education is not just to boost you up - but to challenge you and give you a chance to see what you can do. If a student fails three times they will not be able to try this particular program again, but with the knowledge they gain, they can try it with their own money.


